Built for growing FMCG brands
How much to invest in growth — and what it can do to revenue and EBITDA by Year 3.
A three-year growth and operating model for FMCG businesses. It models the growth your business can support, the commercial and marketing investment it requires, and what both do to operating profit.
Start by establishing where you actually stand: your Year-1 Operating P&L, on screen in about six minutes, free. The three-year model is €99.
About 6 minutes · No card required · Answers save as you go
Before you sign off the next year
You know your revenue.
Do you know what survives it?
Four things a revenue figure cannot tell you:
- What is left of it after trade discounts.
- What one unit really costs you, delivered.
- Your EBITDA margin — not your gross margin.
- Which single line is eating the difference.
Every one of them can move the wrong way while revenue goes up. That is exactly what a revenue figure hides, and it is usually hiding it at the moment the budget gets signed.
All it takes
8 numbers you already have — volume, average price, trade discount, COGS per unit, logistics per unit, marketing, payroll and G&A. About six minutes, and nothing to dig a document out for.
Who it is for
Founders and management teams with a product already selling, or ready for commercial launch, and operating economics they can describe — facing a decision about how hard to grow, how much to put into marketing, or whether to enter a new country, without an in-house team that can build and challenge a three-year model.
And who it is not
- Multinationals with their own FP&A, strategy and MMM teams
- Idea-stage companies with no route to market or unit economics yet
- Anyone after bookkeeping software, a budgeting platform or a valuation
01The problem
Most FMCG plans rest on assumptions nobody has priced.
Revenue targets, marketing budgets and investment decisions get made from instinct and last year's spreadsheet. Without a consistent method, the questions that actually decide the year go unanswered.
- 01How fast can we realistically grow?
- 02How much should we invest in marketing?
- 03Which channels deserve the largest share of that budget?
- 04What profitability can we actually reach?
- 05How much commercial investment does sustainable growth require?
Answering any of them starts with knowing where you actually stand today. That part costs nothing.
02Free baseline
Six minutes to your actual operating economics.
8 figures you already have, returned as the Year-1 Operating P&L in full — gross revenue down to EBITDA, on screen the moment you finish.
Year-1 Operating P&L
€0Your own figures, restated as a clear operating P&L — from gross revenue down to EBITDA. On screen the moment you finish, and yours to print or save.
- Full Year-1 Operating P&L — gross revenue down to EBITDA
- Gross, contribution and EBITDA margins
- Per-unit economics on every cost line
- Flags on the numbers an analyst would question first
No forecast, no benchmarks, no growth assumptions. It is arithmetic on your numbers — which is exactly why we can give it away.
Where the money goes, Year 1
- Net revenue
- €236,160
- Gross margin
- 58.3%
- Contribution
- 50.7%
- EBITDA margin
- 5.0%
03The next question
Your own figures show where you are. Not where you could be.
The statement above uses no forecast assumptions — it simply restructures one year of the figures you provided. That is also where it stops. Everything past it turns on how your category and your marketing respond, and response has to be modelled.
Shown by your figures
Left to the model
5.0%
EBITDA margin, this year
Left to the model
Whether that is the ceiling for this category and region, or well under what it supports.
€40,000
Marketing spend — 16.9% of net revenue
Left to the model
What a larger budget would return, which channels would carry it, and where the return flattens out.
€11,760
Operating profit, this year
Left to the model
What it becomes by the end of Year 3, and the commercial investment that gets it there.
Nothing in the right-hand column is missing from the statement by oversight. Arithmetic on one year of your own figures cannot produce it — that takes category benchmarks, a marketing response model and three years of forward P&L.
04The three-year model
One model. Three decisions.
How fast to grow, how much to invest to get there, and what that strategy does to operating profit — answered against your own baseline, your category and one objective you choose.
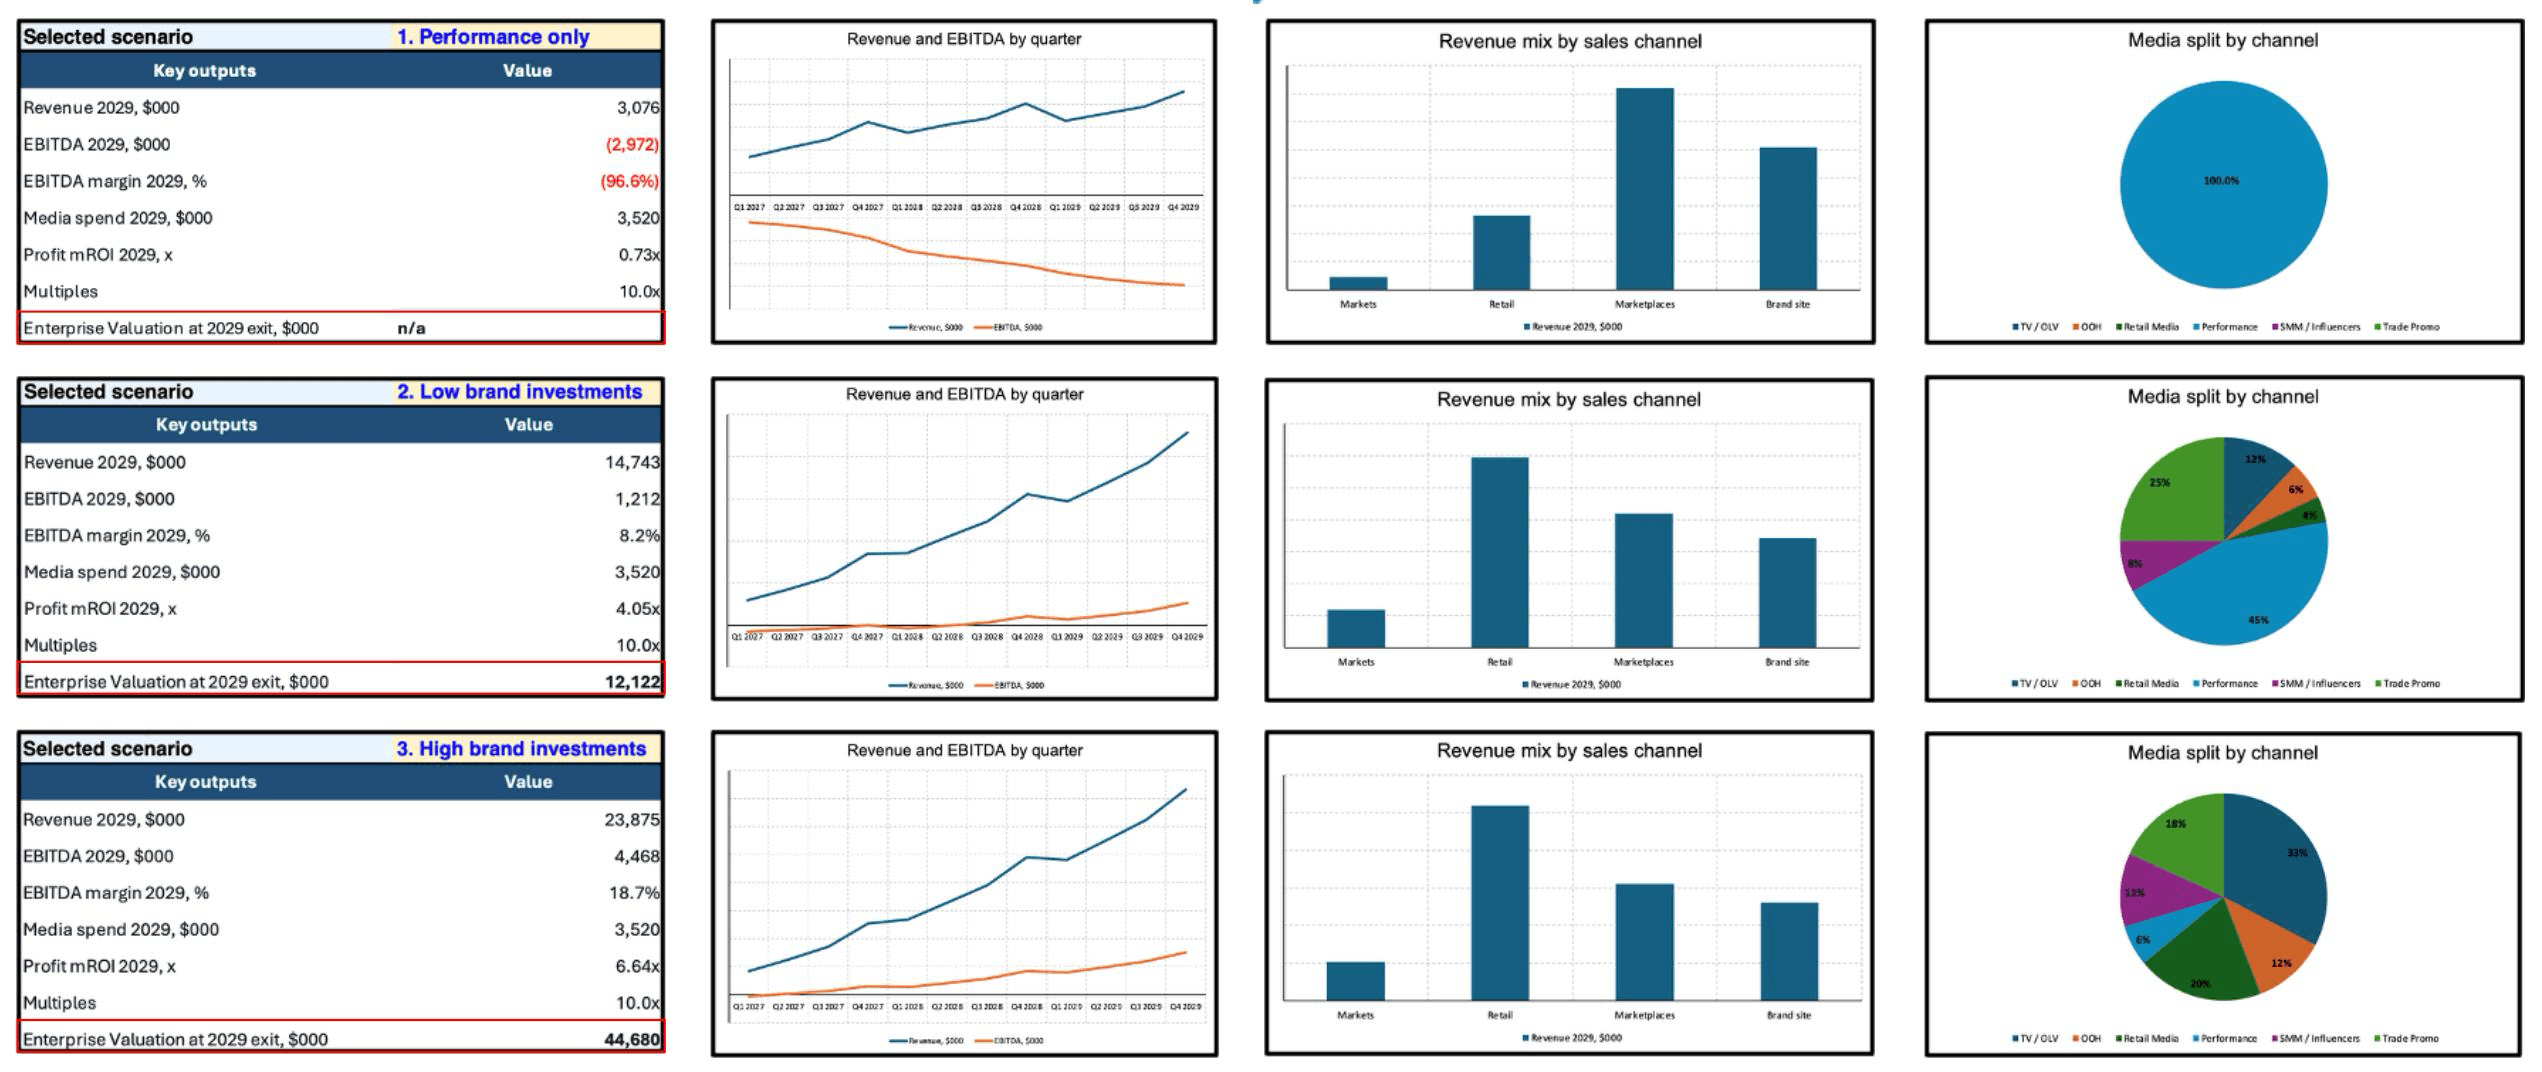
3-Year Growth Strategy & Financial Model
€99Built from your baseline against category benchmarks, growth models and marketing mix modelling — then read by an analyst before it reaches you.
- Executive Summary
- Three-year sales volume & revenue forecast
- Three-year Operating P&L
- Commercial investment plan
- Annual marketing budget recommendation
- Marketing budget allocation by channel
- Editable Excel financial model
- Management PDF report
The Excel model stays fully editable, so it keeps working after delivery. Launch price, one-off — no subscription, nothing recurring.
05Process
Three steps, and only one of them costs money.
- 01
Answer the questionnaire
Four short steps — profile, objective, your operating numbers, a review. Five if you are entering a new market. It adapts as you go and never asks a question it does not need.
- 02
Get Year 1 immediately
Your Operating P&L appears on screen the moment you finish, with the lines an analyst would question already flagged. This is the free part, and it is yours either way.
- 03
Upgrade only if it is worth it
Then the three-year model becomes a decision rather than a leap of faith. Delivered within 24 business hours of payment, after analyst review.
Within 24 business hours — and that clock starts only once payment is confirmed, all required information has been provided, and no material inconsistencies remain unresolved.
06Method
What goes into the paid model
A three-year operating plan, not a spreadsheet template. Each step feeds the next, and every assumption is traceable back to its source.
- 01
Your actual economics
The baseline the free statement just established.
- 02
Category growth potential
What your category and region realistically support.
- 03
Marketing response
What additional spend returns, by channel.
- 04
Required commercial investment
What the chosen growth path costs to fund.
- 05
Three-year operating P&L
Revenue, margin and EBITDA, year by year.
Each link is built with category and regional benchmark libraries, growth models, Marketing Mix Modelling, and professional financial modelling — and every report is read by an analyst before it is sent.
07Objectives
Choose what the three years should optimise for
One objective per report. It changes the growth trajectory, the marketing logic and the recommendations — so a revenue plan and a margin plan never come back looking the same.
Maximize Revenue Growth
- Objective
- Maximise revenue by the end of Year 3
- Held fixed
- Your category potential and your available commercial investment
Marketing response decides what is achievable inside those limits, and the resulting economics stay visible throughout — so what the growth costs is never hidden.
Maximize Year-3 EBITDA
- Objective
- Maximise operating profit by the end of Year 3
- Held fixed
- The three-year commercial investment you are able to fund
Earlier-year margins may be lower where upfront investment supports a stronger Year-3 result.
New Market Expansion
- Objective
- Reach your Year-3 market position in one new country
- Held fixed
- One country and one primary route to market
Here the position is your target and the path is the output: the sales trajectory, marketing and commercial investment required to get there.
08Pricing
Two lines. That is the whole price list.
One free tier that never expires, one paid report. Nothing recurring, nothing to cancel.
Year-1 Operating P&L
Complete the questionnaire and it is yours. No card, no trial, no expiry.
3-Year Growth Strategy & Financial Model
One report per order, all 8 deliverables, secure Stripe checkout.
You reach the paid step only after your free statement is on screen.
09Questions
Common questions
Why is the Year-1 P&L free?
Because it is arithmetic on figures you already have. It restructures your own numbers into a standard operating statement — no forecast, no benchmarks. The work worth charging for starts at Year 2, where category benchmarks, growth models and marketing mix modelling come in.
Who is this built for?
FMCG companies: existing businesses working from their latest completed financial year, startups working from a planned Year 1, and companies preparing to enter a new country. One company, one country, one primary category per report.
How long does the paid report take?
Within 24 business hours after payment is confirmed, all required information has been provided, and no material inconsistencies remain unresolved. If something needs clarifying, we ask before the clock starts.
Who actually prepares it?
The analysis combines proprietary Growth Intelligence models, benchmark libraries and marketing mix metamodels with professional analyst review. Every report is read by a person before it is sent.
Is the Excel model editable?
Yes, fully. It is meant to keep working after delivery — adjust assumptions, re-run scenarios, use it for internal planning.
Can I change my answers?
They stay editable right up to payment and save automatically as you go. After payment the questionnaire is locked so the report is built from a fixed version; changes after that need analyst approval.
Is my information confidential?
Yes. Your business information is used solely to prepare the report you asked for. Card details are handled by Stripe and never touch our servers.
Will the report guarantee these results?
No, and be careful with anyone who says otherwise. It gives you a quantified, benchmarked plan and the assumptions behind it — traceable, so you can challenge each one. Business outcomes depend on execution.
Decide the next three years on numbers, not instinct.
Start where you actually stand: six minutes of questions and your Year-1 Operating P&L is on screen, free. The three-year model is the step you take once that baseline is in front of you.